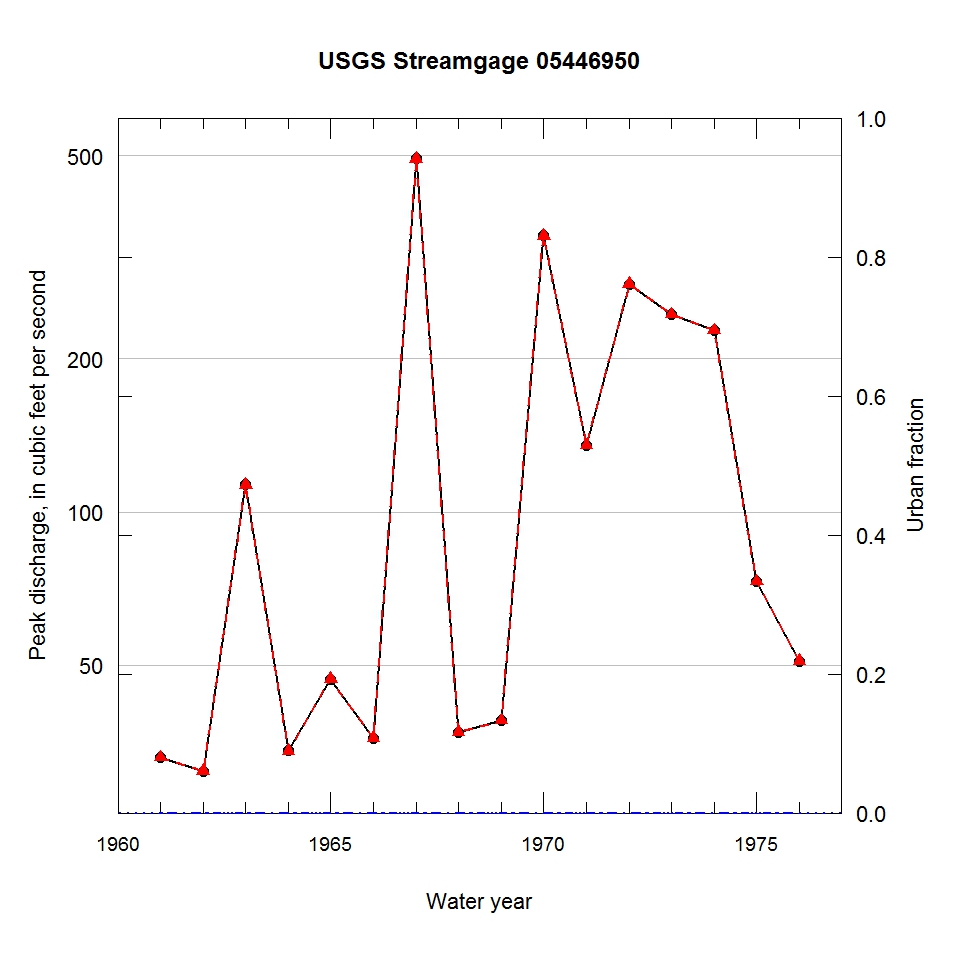
Observed and urbanization-adjusted annual maximum peak discharge and associated urban fraction and precipitation values at USGS streamgage:
05446950 GREEN RIVER TRIBUTARY NEAR AMBOY, IL


| Water year | Segment | Discharge code | Cumulative reservoir storage (acre-feet) | Urban fraction | Precipitation (inches) | Observed peak discharge (ft3/s) | Adjusted peak discharge (ft3/s) | Exceedance probability |
| 1961 | 1 | -- | 0 | 0.000 | 0.590 | 33 | 33 | 0.925 |
| 1962 | 1 | -- | 0 | 0.000 | 1.025 | 31 | 31 | 0.932 |
| 1963 | 1 | -- | 0 | 0.000 | 0.440 | 113 | 113 | 0.384 |
| 1964 | 1 | -- | 0 | 0.000 | 1.090 | 34 | 34 | 0.920 |
| 1965 | 1 | -- | 0 | 0.000 | 0.863 | 47 | 47 | 0.851 |
| 1966 | 1 | -- | 0 | 0.000 | 1.472 | 36 | 36 | 0.910 |
| 1967 | 1 | -- | 0 | 0.000 | 0.808 | 493 | 493 | 0.008 |
| 1968 | 1 | -- | 0 | 0.000 | 0.284 | 37 | 37 | 0.906 |
| 1969 | 1 | -- | 0 | 0.000 | 0.166 | 39 | 39 | 0.896 |
| 1970 | 1 | -- | 0 | 0.000 | 1.525 | 348 | 348 | 0.018 |
| 1971 | 1 | -- | 0 | 0.000 | 0.335 | 135 | 135 | 0.275 |
| 1972 | 1 | -- | 0 | 0.000 | 1.172 | 280 | 280 | 0.037 |
| 1973 | 1 | -- | 0 | 0.000 | 1.687 | 244 | 244 | 0.055 |
| 1974 | 1 | -- | 0 | 0.000 | 1.797 | 227 | 227 | 0.066 |
| 1975 | 1 | -- | 0 | 0.000 | 0.854 | 73 | 73 | 0.674 |
| 1976 | 1 | -- | 0 | 0.000 | 0.002 | 51 | 51 | 0.828 |

